# HBar(r|y:Row, c|x:Col, h:Height, w:FSWidth, v:Value) hash function
Valid for use with hash command: HMI. Arguments may be specified as Name:Value Pairs
Implemented on the following platforms: HMi430, Android, Windows
This function will draw one bar of a horizontal bar graph. This is useful for indicating analog values graphically.
Replaces HBarOld, which is deprecated
The parameters are:
Row | The screen row where the top of the bar is to be positioned. This refers to character rows in the default font size. Row numbers are 0 based, so the top row is row 0. |
Col | The screen position where the left of the bar is to be positioned. This refers to character columns in the default font size. Column numbers are 0 based, so the start of each line is 0. See the table below for more detail. |
Height | The height of the bar. See the table below for more detail. |
FSWidth | The full scale width of the bar. This is the screen width that will be occupied by the maximum fArg value’ |
Value | A floating point variable containing the value to be plotted. Must be between 0.0 and 1.0. Generally specified with a float formatting function. |
The bar is drawn by drawing a rectangle in the current background colour, then on top of that drawing a left-justified rectangle in the current foreground colour whose horizontal length is FSWidth * Value. Value should lie in the range 0.0 to 1.0.
In addition to being simple numbers, the row/column coordinates may also be specified in relative or proportional terms. The following table illustrates the possibilities.
| Format (example) | As a row specifier | As a column specifier |
|---|---|---|
5 | Row number 5 from the top, counting from 0. This can be a fractional number such as 5.5 | Column number 5 from the left, counting from 0 |
-5 | Row 5 from the bottom, counting from 0. This can be a fractional number such as -5.25 | Column 5 from the right, counting from 0 |
0 | The top character row | The left-most character column |
-0 | The bottom character row | The right-most character column |
0.25 | One quarter of (0.25 times) the screen height from the top. Fractional number between -1 and +1 are interpreted as a fraction of the screen. | One quarter of the screen width from the left. |
-0.25 | One quarter of the screen height from the bottom. | One quarter of the screen width from the right. |
C | The top-bottom centre of the screen. | The left-right centre of the screen. |
C+5 | Five character rows down from the centre | Five character widths right from the centre. |
C-5 | Five character rows up from the centre | Five character width left from the centre. |
C+.25 | One quarter character row down from the centre. After a “C” all numbers are interpreted as multiples of the character pitch. | One quarter character width right from the centre. |
C-3.25 | Three and a quarter character rows up from the centre. After a “C” all numbers are interpreted as multiples of the character pitch. | Three and a quarter character widths left from the centre. |
In addition to being simple numbers, the width and height coordinates may also be specified in relative or proportional terms. The following table illustrates the possibilities.
| Format (example) | As a height specifier | As a width specifier |
|---|---|---|
5 | 5 character rows in height | 5 character rows in width |
0.25 | One quarter of (0.25 times) the screen height. Always calculated as a full number of rows, always rounded down, but forced to be at least 1. | One quarter of (0.25 times) the screen width. Always calculated as a full number of columns, always rounded down, but forced to be at least 1. |
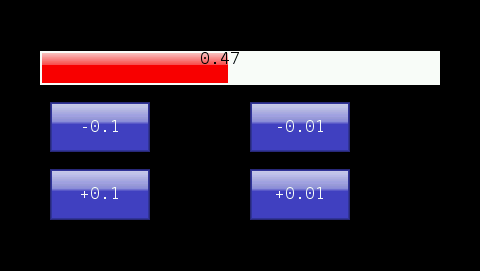
Example. The following program will produce the result shown below on an HMI430. The bar is drawn with a red foreground and white background. The buttons can be used to change the bar length:
(Click here for some tips for working around problems with copy and paste out of Internet Explorer and HTML-help (.chm) files)
;======= Demonstrate Hbar hash function.  For HMI430 ==================
;Lacks serial port assignment/initialisation required to work on Android or Windows
        GoSub           PaintHomeScreen
        fLoadW          0.4            ;An initial value for the bar
        fStore          fHValue
        GoSub           DrawGraph
        RunTasksForever

fHValue defFLOAT

;---------------------------------------------------------------
PaintHomeScreen:
# HMI Reset() HideAllButtons() SetColours(f:'FFFFFF, b:'0) Cls()    ;Blue screen
# HMI  SetColours(f:'FFFFFF, b:'4040C0)      ;For buttons
# HMI ButtonEvent2(r:6, c:5, h:3, w:10, t:"-0.1", ev:EvMinusP1)         ;Buttons to alter value
# HMI ButtonEvent2(r:10, c:5, h:3, w:10, t:"+0.1", ev:EvPlusP1)         ;Buttons to alter value

# HMI ButtonEvent2(r:6, c:25, h:3, w:10, t:"-0.01", ev:EvMinusP01)         ;Buttons to alter value
# HMI ButtonEvent2(r:10, c:25, h:3, w:10, t:"+0.01", ev:EvPlusP01)         ;Buttons to alter value
         Return

;---------------------------------------------------------------
;Button Event handlers. Let the user change the value plotted
EvMinusP01:
        fLoadQ          -0.01
        GoTo            ChangeVal
EvPlusP01:
        fLoadQ          0.01
        GoTo            ChangeVal
EvPlusP1:
        fLoadQ          0.1
        GoTo            ChangeVal
EvMinusP1:
        fLoadQ          -0.1
ChangeVal:
        fRecallW        fHValue
        fAdd
        fStore          fHValue
;-----------------------------------------------------------------
DrawGraph:
# HMI SetColours(b:'FFFFFF, f:'FF0000)
# HMI HBar(r:3, c:4, h:2, w:40, v:f(*fHValue, 4, 2))
# HMI SetColours(f:'000000, b:'00000000) SetCursor(3, 20) Print(f(*fHvalue, 4, 2))
        Return